How can we make rotational flow visible?
A great variety of measuring instruments is available for flow measuring. Depending on the medium, temperature, pressure and other parameters, different sensors are suitable. A basic requirement for these measurements is a symmetrical, steady flow profile.
Based on the flow velocity in the centre of the pipeline average flow velocity can be calculated and therefore also the flow rate. In practice, valves, elbows etc. cause interruptions in flow which makes accurate measurements really difficult or not possible at all. In these cases the resulting flow can be interrupted axially which means the maximum flow velocity is not in the centre of the pipeline,
How is the rotational flow model built?
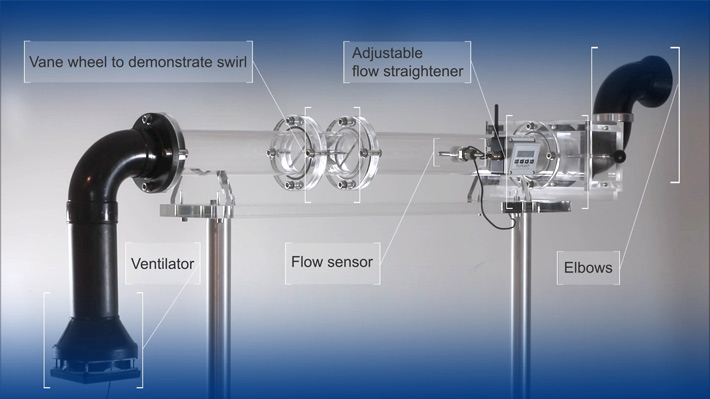
The rotational flow model has two elbows that are connected in the direction of low. There’s no rotation when they’re in their original position. However if the elbows are twisted to each other it creates rotational flow downstream and the vane wheel starts turning.
The rotational flow model also includes a flow-rectifier. Once it enters the rotational flow it cancels out the rotation. When the flow is undisturbed the vane wheel stops moving. This shows the effect of a flow-rectifier.
Why is rotational flow economically so important?
There’s more and more research on rotational and turbulent flow because they occur in different applications and control important features. The rotational flow’s stabilising effect aids the optimal flow in burners. The rotational effect is also used when separating particles according to their size.
What are some unwanted side effects of rotational flow?
Rotational flow is an interference of flow and causes faults in measurements and their measuring instruments. That’s why research on how to reduce rotation in flow is of great economical importance for example for users of big pipelines for fuel and natural gas. False measuring results caused by rotational flow lead to calculating errors and in the worst case to risks regarding safety.
What consequences does rotation in flow have?
When there´s rotation in the flow, the gas in the pipeline moves in spirals. These gas particles move further in a defined pipe length compared to flow with no rotation and the same flow velocity. The longer path also causes higher losses of pressure which means loss of energy and therefore higher costs. Our rotational flow model visualises this process.
How is rotational flow visualised?
When cross flow occurs not only axial forces but also rotary forces are put on the Höntzsch sensor’s vane wheel, causing it to turn. The rotary part of the flow moves the vane wheel within the rotational flow model.
Where has visualising flow with the rotational flow model proven itself?
The rotational flow model has proven itself for visualising flow in research and teachings in universities, training of engineers and technicians. Students of thermodynamics, flow mechanics and process engineering can experience the phenomena of flow – with and without rotation. Paired with the right flow measuring sensors many different experiments can be done illustrating flow. The rotational flow model helps with interpretation and definition of pipe geometry and measuring points.
The rotational flow model also helps our partners abroad when consulting customers regarding rotational flow.


